
India-Africa trade has seen massive growth from 2000, reaching around $100 billion in 2024-25, establishing India as Africa’s third-largest trade partner. Key drivers include India’s strong exports (pharmaceuticals, electronics, engineering goods) and Africa’s rich resources (fuels, pearls, metals), with a shift towards digital cooperation and infrastructure projects like railways, aiming to double trade by 2030 despite geopolitical challenges.

India–Africa Trade Volume 2000–2026
India-Africa bilateral trade has grown substantially from around $4.45 billion in 2000-01 to $103 billion in FY 2025. This expansion reflects diversification into sectors like pharmaceuticals, agriculture, and energy, with a cumulative trade of over $1 trillion across key periods. Trade surged eight-fold from 2000-2010 at a 24.24% CAGR, slowed to 2.58% CAGR in 2010-2020 amid global slowdowns, then rebounded post-COVID at 6.32% CAGR through 2022-23.
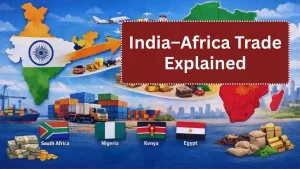
Exports often outpaced imports recently, reaching near balance by 2022-23 with India’s pharmaceuticals and machinery driving gains. Key partners include Nigeria, South Africa, and East African nations for oil, minerals, and consumer goods.

Complete Data & Analysis
India–Africa bilateral trade data from 2000–01 to 2024–25 is fairly well documented, and it shows a rise from about 4.45 billion dollars to just over 100 billion dollars, with FY 2025 at 103 billion dollars. The structure of this trade has shifted from a narrow focus on oil and raw materials to a broader basket including petroleum products, engineering goods, pharmaceuticals, agriculture, and energy-related flows.
| Year / FY* | Total trade (exports + imports) |
|---|---|
| 2000–01 | 4.45 |
| 2001–02 | 5.1–5.3 |
| 2004–05 | 11–12 |
| 2005–06 | 11.87 |
| 2007–08 | 21.6 |
| 2009–10 | 39.05 |
| 2011–12 | 68.54 |
| 2013–14 | 67.85 |
| 2015–16 | 56–60 |
| 2018–19 | 69.65 |
| 2019–20 | 56.0 |
| 2020–21 | 60 |
| 2021–22 | 89–90 |
| 2022–23 | 97.84 |
| 2023–24 | 83.0–83.4 |
| 2024–25 (FY 2025) | 103.0 |
How trade composition changed?
India–Africa trade has shifted from a narrow, commodity‑heavy pattern in the early 2000s to a more diversified structure dominated by refined fuels, manufactured goods, and pharmaceuticals on the export side, while imports remain concentrated in crude oil, minerals, and gold. Agriculture and food products, especially rice and sugar, have also become more important in India’s export basket to Africa.

“On the trade and economic front, India is the fourth largest trading partner for Africa with a bilateral trade of about US$ 100 billion.”- Dr. S. Jaishankar, External Affairs Minister
Also Read Fastest Growing African Markets for Indian Exporters in 2026
Structural trends
- Rising manufactured content: India’s exports to Africa now lean clearly toward manufactured and processed products refined fuels, automobiles, machinery, electrical equipment, and pharma rather than basic goods, which increases value addition on the Indian side.
- Complementary pattern: The trade relationship has settled into a complementary structure: Africa supplies raw materials and energy, while India supplies refined fuels, manufactured goods, and health and food products, a pattern highlighted across CII and ICRIER analyses.
- Geographic diversification: Over time, both exports and imports have diversified beyond a few partners like South Africa and Nigeria to include a broader set of West, East, and North African economies, though West Africa still dominates energy trade.
Growth phases
India–Africa trade since 2000 can be grouped into three main growth phases: a rapid take‑off, a slower consolidation, and a post‑COVID rebound into the 100‑billion‑dollar era.
| Phase & period | Approx. trade range & CAGR | Key features & drivers |
|---|---|---|
| Phase 1: Take‑off (2000–2010) | Trade rose from about 4.45 bn USD in 2000–01 to nearly 39 bn USD by 2009–10; CII estimates CAGR ≈ 24.24%; cumulative trade 183.23 bn USD. | Launch of Focus Africa (2002), high commodity prices, and India’s fast growth drove an eight‑fold rise; Africa became a key source of oil and raw materials and an emerging market for Indian manufactured goods. |
| Phase 2: Consolidation (2010–2020) | Trade peaked near 68–78 bn USD around 2011–2014, then fluctuated mostly in the 50–72 bn USD band; decade‑long CAGR only about 2.58%. | Global slowdown, commodity‑price corrections, and domestic constraints moderated growth, but trade structure diversified into engineering goods, pharma, autos, and services while energy and minerals stayed central. |
| Phase 3: Rebound & 100‑bn era (2020–2025) | From 56 bn USD in 2019–20, trade hit 97.84 bn USD in 2022–23 (9.26% y‑o‑y) and about 100–103 bn USD in 2024–25; recent CII calculations put 2018–19 to 2024–25 CAGR near 2.74%. | Post‑COVID recovery, higher energy prices, stronger demand for Indian pharma and engineering goods, and renewed political focus (India–Africa Forum processes, AfCFTA, Lines of Credit) pushed trade past the 100‑bn mark |
Forward outlook to 2026
- CII and EXIM Bank analyses expect trade to keep rising on the back of AfCFTA implementation, Indian investment and Lines of Credit, and focus sectors like renewables, agri‑trade, and pharmaceuticals.
- If current momentum holds, several policy and industry studies suggest India–Africa trade could roughly double again over the next decade, though UNCTAD and others warn that global growth near 2.6% through 2026 may cap the pace.
“India and Africa are shaping a strong partnership to co‑create a shared future, built on mutual trust and collaborative efforts.”- Piyush Goyal, Minister of Commerce and Industry
FAQ’s
How much has India–Africa trade grown since 2000?
Bilateral trade has increased from about 4.45 billion USD in 2000–01 to roughly 100–103 billion USD in 2024–25, implying nearly a twenty‑fold rise.
What are the main items India exports to Africa today?
India now mainly exports refined petroleum products, engineering goods and machinery, pharmaceuticals, vehicles, textiles, and agri‑products like rice and sugar to African markets.
What does India import most from Africa?
India’s imports from Africa are dominated by crude oil and other mineral fuels, gold and precious stones, ores and minerals, and selected agricultural commodities such as cashew.
What are the main challenges to further growth?
Major challenges include logistics and connectivity gaps, non‑tariff barriers, debt stress in several African economies, and competition from other partners such as China and the EU.